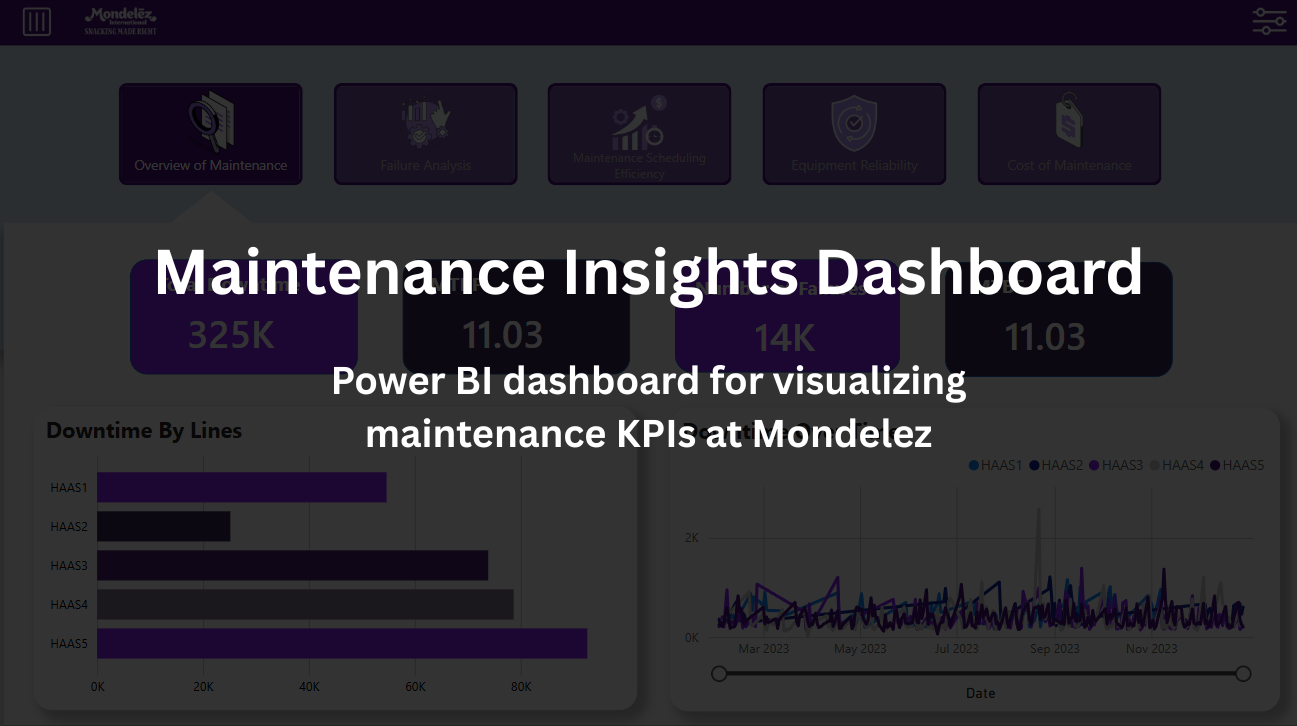
Maintenance Insights Dashboard
Power BI dashboard for visualizing maintenance KPIs at Mondelez
Overview
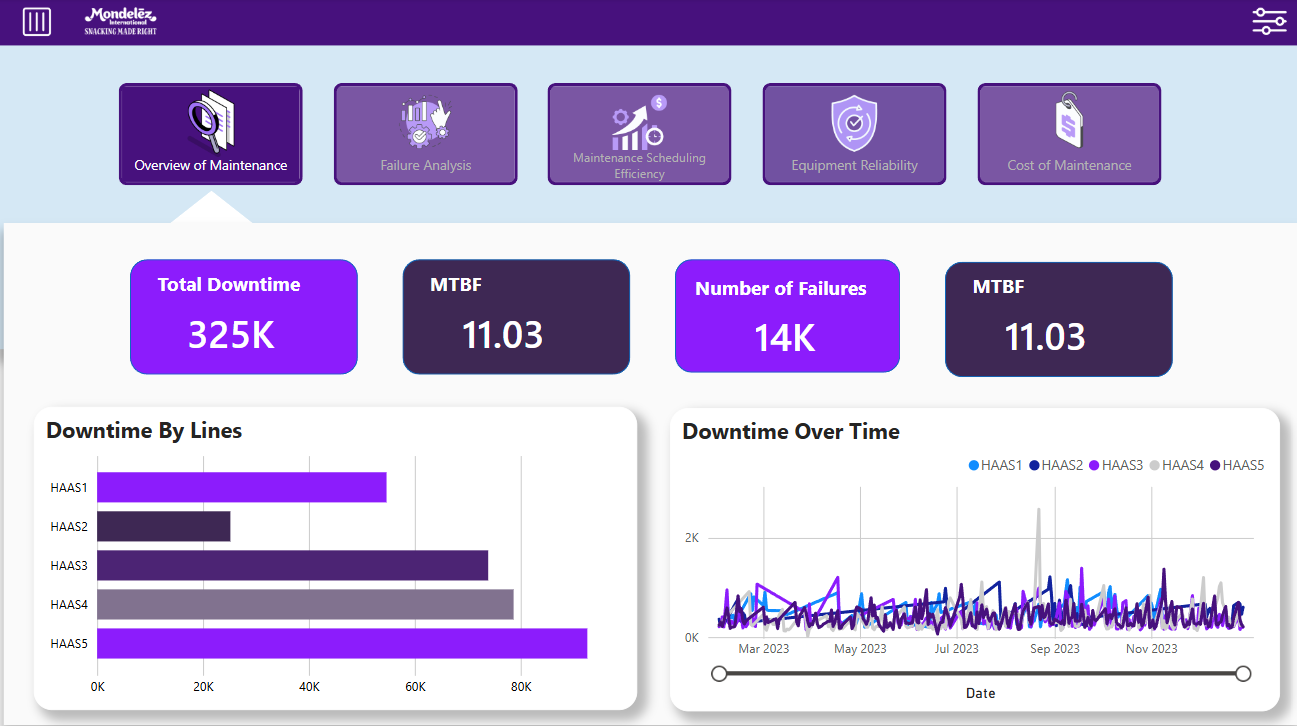
This project involves the development of a Power BI dashboard during an internship at Mondelez International. The dashboard connects to an Excel file on SharePoint to visualize key maintenance KPIs, such as downtime, MTBF, and number of failures. It features interactive filters and slicers for date, production lines, and machines, along with visualizations like bar charts, line charts, and donut charts to analyze operational efficiency and maintenance performance.
Key Features
- Connection to SharePoint Excel file for real-time data updates
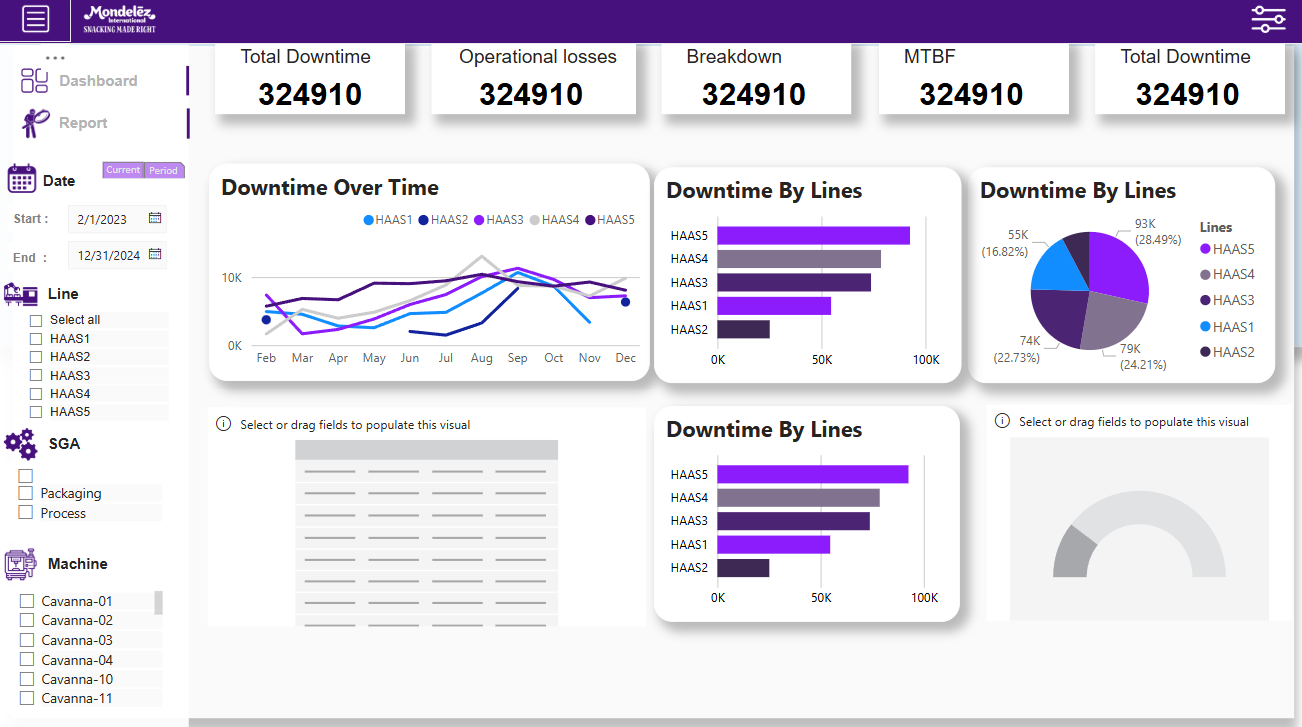
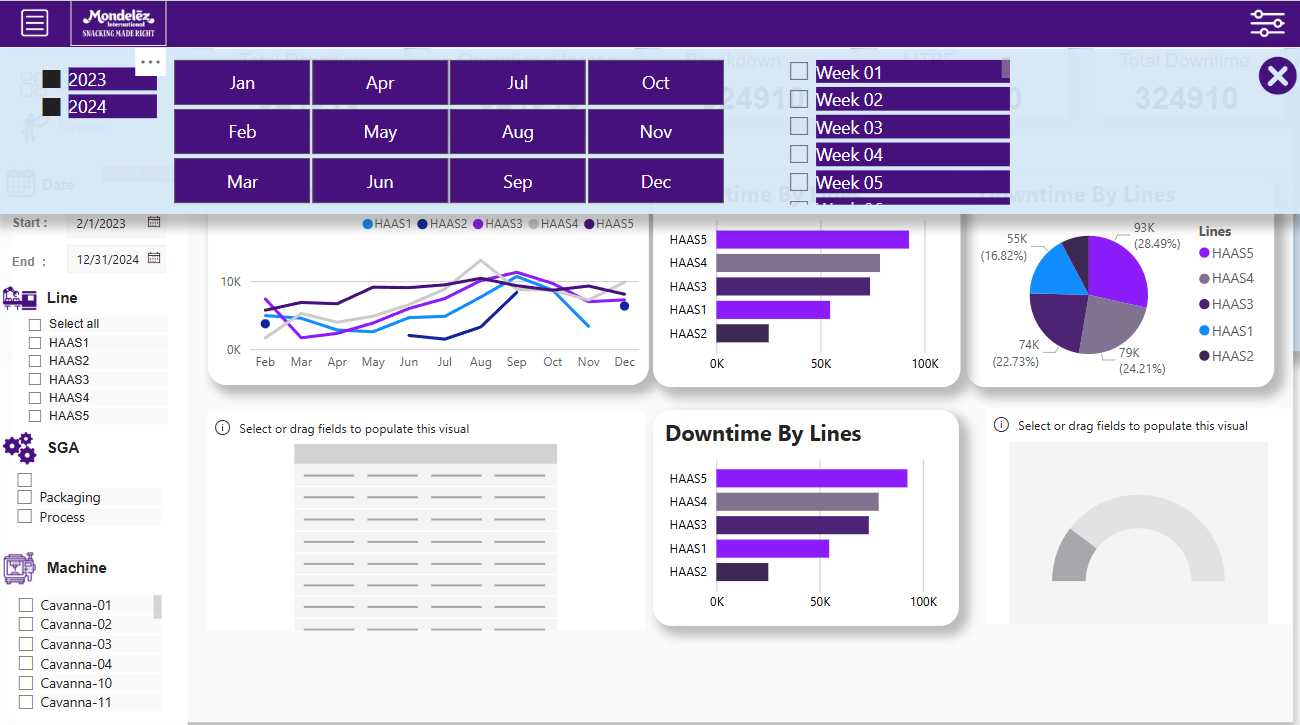
- Interactive filters for date (year, month, week), production lines, and machines
- KPI cards displaying metrics like Total Downtime, MTBF, and Number of Failures
- Bar charts and line charts for downtime analysis and trend visualization
- Donut charts for downtime distribution across production lines
Development Process
The dashboard was built using Power BI, with data sourced from an Excel file hosted on SharePoint. The development process included designing the data model, creating calculated measures for KPIs, and implementing interactive visualizations. Mock data was used to ensure confidentiality while demonstrating the dashboard's capabilities.
Project Details
- Date
- 2024
- Category
- Data Analytics
- Team
- Mohamed Boukri
- Client
- Mondelez International
Technologies Used
Challenges and Solutions
Handling Large Data Volumes
The Excel file contained extensive historical data, requiring efficient data modeling to ensure dashboard performance.
Solution: Optimized the data model by using summarized tables and leveraging Power BI's data aggregation features.
Ensuring Data Confidentiality
Due to sensitive operational data, the dashboard needed to be developed with mock data while maintaining realism.
Solution: Created a representative mock dataset that mirrored the structure and variability of the actual data without exposing confidential information.
Results and Impact
The dashboard provides Mondelez with a powerful tool for monitoring and analyzing maintenance KPIs, enabling data-driven decisions to improve operational efficiency. It has been well-received by the maintenance team for its intuitive interface and actionable insights.
Project Gallery